Draw the chart.

Scatter plots, bar charts, trend charts, and 3D charts come from the research. They stay in the vector editor. Tell the AI what to change, and it changes only that part.
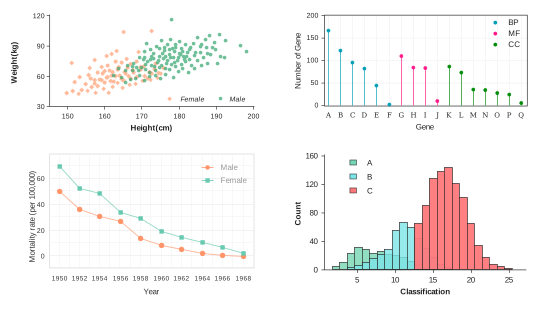
Research draws it. The vector editor revises it.

A chart open in the vector editor

The chart comes from the research

Give a chart type, the data, or the dimensions to compare. The system researches first, then draws the chart.

Revise it again in the vector editor

Series, color, labels, and layout can all be changed again. You edit this vector, instead of saving a finished picture.

Tell the AI what to change

Point to the series, the color, or the label. The AI changes that part and leaves the rest. The whole chart does not get redrawn.

Charts you can draw

Common statistical diagrams can be drawn from a description. The four below are examples.

Scatter plot

Density plot

3D chart

Bar chart

Send it in the chat, then revise it in the editor

Enter the task and send. After the chart is drawn, keep editing it in the vector editor.

Step 1

Enter the task and send

In the chat, enter the task, the data, the chart type, or a reference chart, then send.

Step 2

Revise the chart in the vector editor

After the chart is drawn, keep editing it in the vector editor.

You can say it like this

Say it is a vector, and name the chart type. Keep the topic in marketing, commerce, research, or product, and compare only a few numbers that can be found.

Questions that come up while drawing a chart

Is the result a picture?
When you ask for a vector in the chat, the result is a vector file, and you can keep editing it in the vector editor.
Which charts can I draw?
Scatter plots, bar charts, trend charts, 3D charts, and similar charts. A distribution fits a scatter plot. A comparison of counts fits a bar chart. A change over time fits a trend chart.
Where do the numbers come from?
Numbers you provide are labeled on the chart. If you do not provide numbers, it uses material read in this research and should name the source.
How do I change one part?
In the vector editor, tell the AI what to change: a series, a color, or a label. It changes that part. The whole chart does not get redrawn.
Does it use credits?
Yes. The research and later AI edits use credits.
Where is the file stored?
On this device, with the other documents in the library. It is not uploaded to a cloud drive.

Draw a chart from the research.

It stays in the vector editor. Tell the AI what to change, and it changes only that part.

Get started for free